It turns out that video content is working well for the majority of businesses, but what about yours? Think you might need to optimize your video performance? Ask yourself if you are getting your share of these benefits:
- More Engagement: Posting a video on social platforms helps generate 1,200% more shares than text and images combined.
- More Traffic: Video helps attract two to three times as many monthly visitors. In fact, having a video on your landing page makes it 53% more likely to show up on the first page of the SERPs according to Mist Media.
- More Backlinks: Blog posts incorporating video helps attract 3x as many inbound links as blog posts without video says Moz.
- More Conversion: Landing pages with explainer videos generated 20% extra conversion.
- More Revenue: Marketers who use video reported 49% faster revenue growth than non-video users.
Want to Optimize Your Video? First Understand the Metrics…
While a single video can help you generate all these big results, the best practice is to create one video for one purpose.
If you end up bagging extra results, kudos to you! But don’t mix up too many goals with one video. That would mess up the video content, leaving you with a video that doesn’t generate any ROI.
To understand how your video is performing, have a look at the video analytics. Looking at just “views” or “clicks” alone wouldn’t give you a clear picture of whether your video is driving the expected results. You need to dig deeper. Here’s some video metrics that will help you find out how well your video is doing. The insights will help you make the necessary edits to boost your video’s performance.
5 Key Insights to Optimize Your Video
1. Watch Time
YouTube changed the way it ranks video (back in 2012). While preference was given to views, a more clear metric of a video’s performance became its priority: watch time.
Watch time helps you know the actual portion of your video that has been watched. This metric allows you to monitor whether your audience is watching your video all the way through – or not.
How is that useful?
People are 97% more likely to buy your product when they find your video engaging, which means there is a higher probability of them buying something when they have watched your video for a longer time (or completed it).
How to optimize?
One good way to understand user behavior is to employ heatmaps to see what parts of the video engage the most users. Heatmaps will show you the interactions between the viewers and the video.
Through video heatmaps, you can gain insights on the strong and weak points in your video. With that knowledge, you have a better chance of keeping your audience around till the very end – a classic example of how knowledge can be your power.
And if viewers are tuned in till the end, there is a very good chance that they will make the purchase, too.
2. Drop-Off Point
Under the audience retention section on YouTube, you can find a drop-off point metric. As the name implies, this metric helps you monitor the points at which your viewers leave your video.
Sharp drop-off points indicate the most poorly performing regions of your video. They can be really beneficial in understanding what makes users leave. It is just as important to know why they leave as knowing what makes them stay, if not more so!
How to optimize?
Since drop-off points help you understand where users “drop” your video, this metric can help you find out if it’s just a “lengthy video versus engagement rate” problem, or if there is some issue with the content.
While it’s very difficult to expect an ideal straight line, what you need to avoid are sharp drop-offs.
3. Click-Through Rate (CTR)
Calls-to-action (CTAs) in your video compel your audience to complete an intended action. This is what CTR helps you measure.
This metric gains even more significance when it comes to video ads. Since video ads are mostly centered around “being salesy,” it is important to have clarity on whether your call-to-action navigated your viewer further or not.
How to optimize?
This metric can be more successfully optimized with the knowledge of drop-off points. Because maybe your audience dropped off way earlier, and never saw your CTA!
If that’s the case, try placing the call-to-action at a different point in your video (and also focus on preventing any sharp drop-offs).
In cases where CTA is the only problem, and not engagement, try making it more visually appealing or modify the CTA text. Also ensure that it’s relevant to the video content that you are serving to your viewers.
4. Views & Demographics
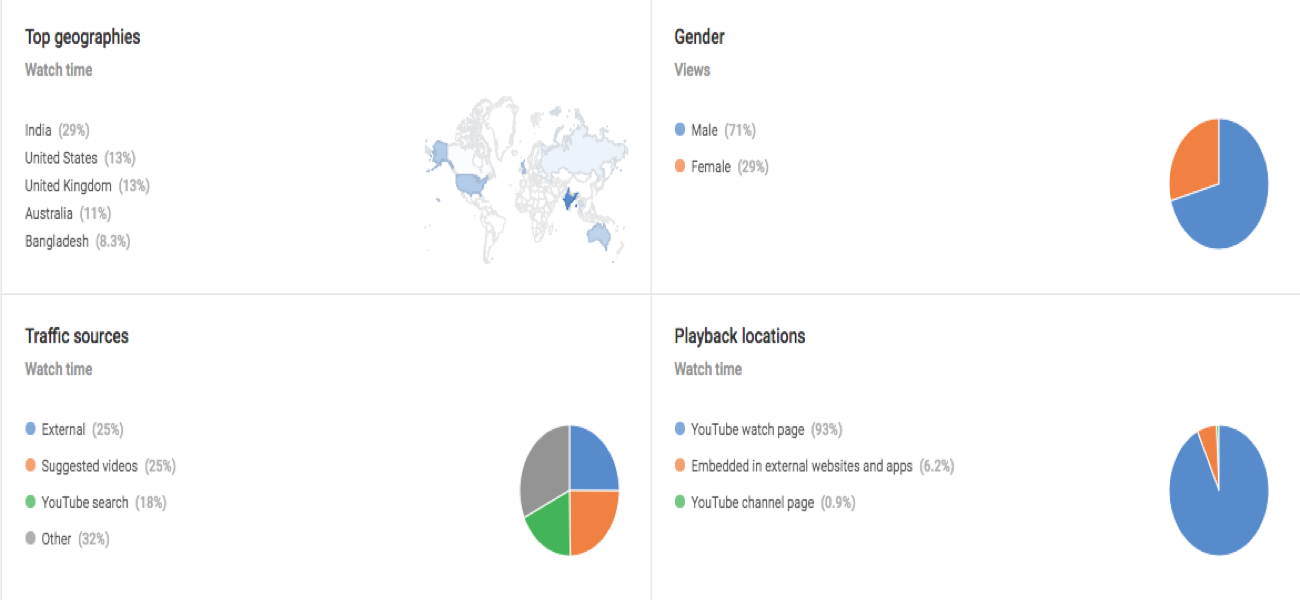
While view count is a vague measure of how your video is performing, it matters to know who’s watching your video, from which location, and from which devices.
Additionally, views become more important when you take social video into account.
Facebook and Nielsen research found that about 74% of the value of the video is delivered in the first 10 seconds.
Analyzing the views section (especially over a longer period of time) can help you determine whether or not your video campaign is getting the right eyeballs. It’s also a good way to track which content is evergreen, and which video is just a passing fad.
How to optimize?
Monitor this metric consistently to avoid “video pitfalls,” where users stop engaging with your content. Find the loopholes. See which devices your audience is playing your video from, and optimize for it.

Screenshot provided by contributor.
If you published your video on your website, see how video posting translates on the views graph. Change the video’s position. See if your audience engaged more with the video when it was on the top fold of the landing page or when it appeared as a popup window on click. Do A/B testing to understand which version performed better.
Finding answers to these optimization questions can help improve your ROI from the video.
5. Comments, Likes/Dislikes, Shares
People trust the recommendations of their friends and family members more than advertising content. Social shares by your audience can help you build that credibility for your product.
If they are commenting on your videos or sharing them, it’s clear that they are engaging with it. What’s more fruitful about these metrics is that they offer a bigger picture of “how they are engaging.”
For instance, likes/dislikes help you understand whether your audience actually feels connected to your content or not.
If you take the case of Facebook reactions (which go further than just likes), they help you understand what the exact emotions of your viewers are when they watch your video.
Comments go a step ahead by giving words to how they feel about your content.
How to optimize?
Encourage interactions at the end of the video. Ask your audience to put their ideas and/or questions under a particular hashtag. Or simply ask them to leave a comment.
Analyze Facebook reactions to see what makes users love your content, or what makes them feel angry. A more apt understanding of these metrics can allow you to design your content more carefully, and help to eliminate content that invites backlash.
Use the Right Recipe to Optimize Your Video
Creating video content is like cooking. A slight error in measuring can greatly alter the end results!
With the knowledge of the metrics mentioned above, you will be in a better position to know whether it’s time to celebrate your video – or to work harder. If you don’t know what success looks like, you might get fooled by the numbers.
Monitor your metrics and utilize them to bake the perfect video. And come back to us if reading this recipe helped you in your campaign!
Do these insights make optimizing more doable for you? Measure your metrics, and do share your thoughts in the comments!
Deepasha Kakkar
Deepasha is a visual marketer, entrepreneur and the founder of Crackitt. She helps businesses & organizations hone their identities, craft their brands, and share their truths using beautiful handmade animated explainer videos, GIFs and infographics.


