For a local business in 2022, the Google Business Profile and optimization must be a key part of your game plan. The volume of targeted traffic available to a business means that the creation, claiming and optimization of a Google Business Profile (formerly Google My Business) will almost certainly deliver new customers to your business. However, with frequent updates from Google it can be hard to determine the value of developing a comprehensive Google Business Profile (GBP).
At Rocks Digital we can attest to the value of utilizing a Google Business Profile and its optimization. While we have optimized and managed many Google Business Profiles on an ongoing basis, today we are going to share the insights from one of our client’s Google Business Profile that we have been tracking for a little over a year.
We started the GBP optimization process on December 15, 2020 when this particular business became a client. Even with initially making only minor adjustments to the Google Business Profile, this business started seeing increased map and search views right off the bat.
On January 25, 2021 we added detailed product descriptions to the client’s Google Business Profile. At this point in the optimization process we had not yet begun to publish GBP posts to the listing. Below you can see the increases for the search and maps views when we started working with the listing. After the products were added to the listing, the views spiked even more significantly.
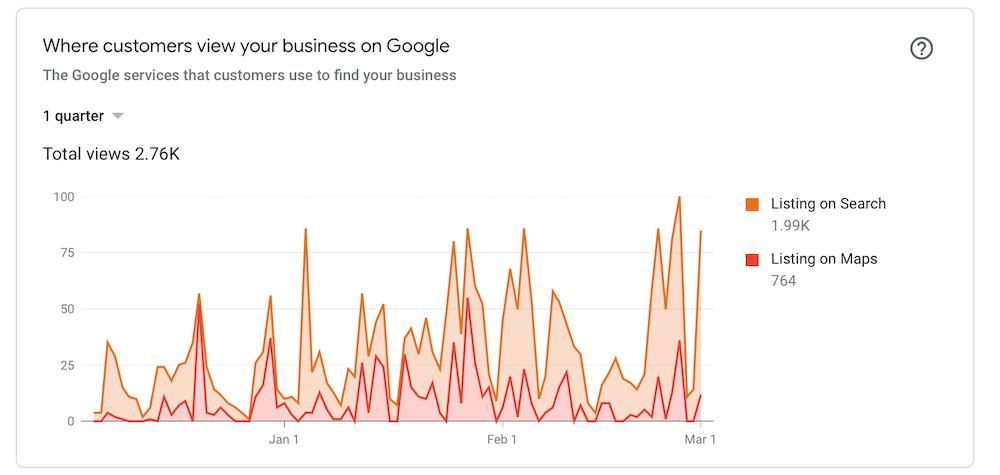
Shown above is the screenshot taken of the business’ GBP at the beginning of March, 2021. As you can see at that time, the business was receiving an average of 2.76k combined map and search views in a quarter.
On March 14, 2021 we launched a new website for the business and started publishing Google Business Profile posts periodically.
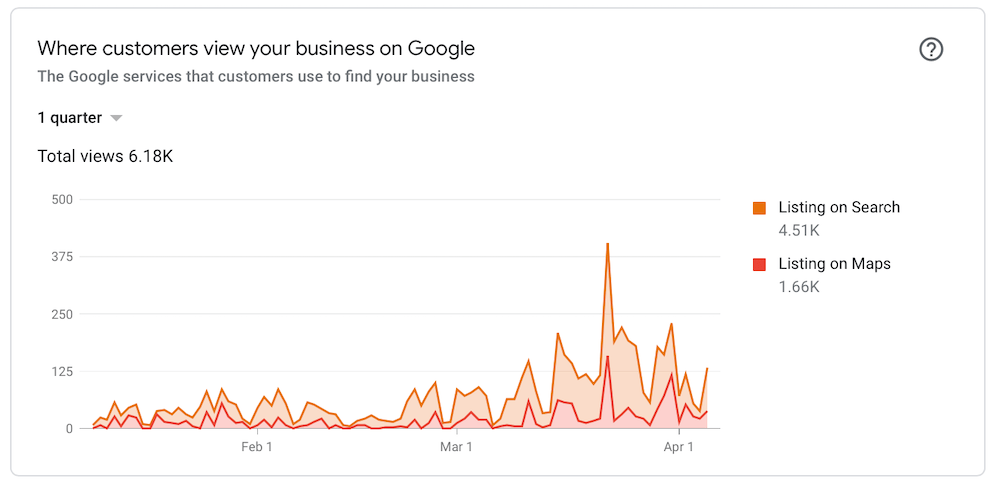
As you can see in the screenshot above taken on April 8, 2021, prior to mid-March the business was getting approximately 125 combined search and map views on a given day.
Once we launched the new business’ website and started publishing GBP posts the views increased up to 400 search views on a single day. And on most days the business received more than 250 combined search and map views. Plus, the combined views for a quarter went from 2.76k to 6.18k.
In June of 2021, we wanted to check back in and see how this listing was performing. Please note, we started publishing a GBP post every week on April 19. Additionally, in April 2021 an ongoing local SEO campaign – which involved publishing new content on the business’ website almost weekly – was initiated. This is in addition to the ongoing publishing efforts made on the business’ Google Business Profile.
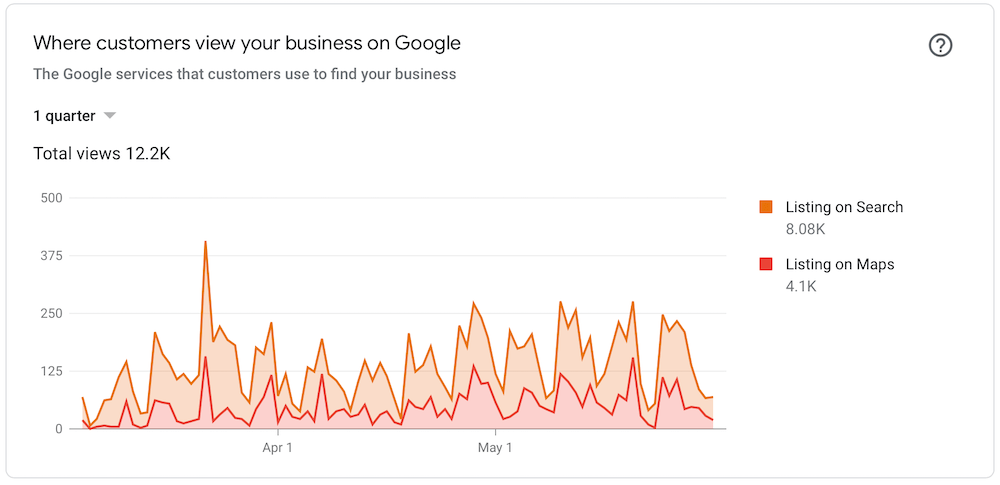
Shown above in this screenshot taken on June 3, 2021, the combined views in a quarter have increased to 12.2k in a quarter. The daily combined map and search views have increased to almost 400, and on some days even higher than this.
While we don’t have screenshots of the entire history, we can also share that the customer actions taken on the business’ GBP went from less than 10 daily to 35 or more.
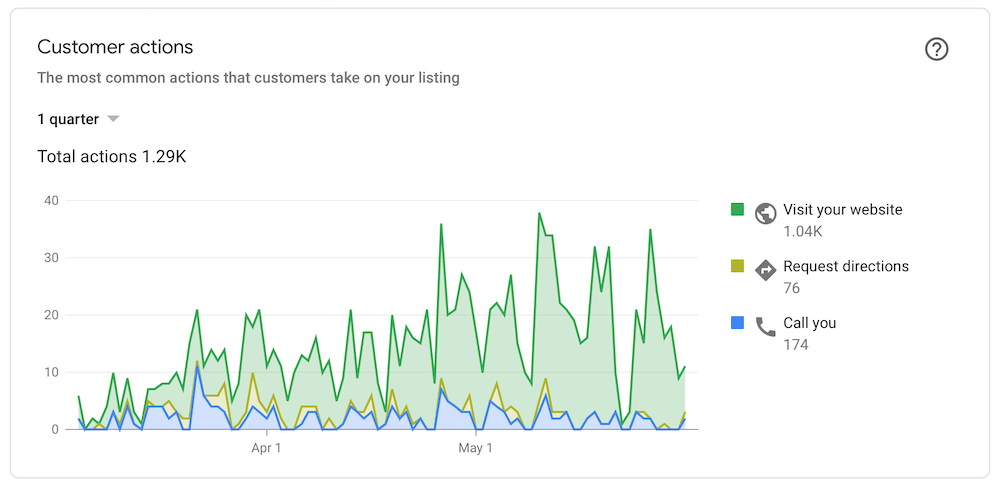
Above is the screenshot taken June 3, 2021 demonstrating those increases once the optimizations were completed.
In August, we dropped back in to check on the listing and see how well it was performing – and whether the combined search and map views were increasing or maintaining.
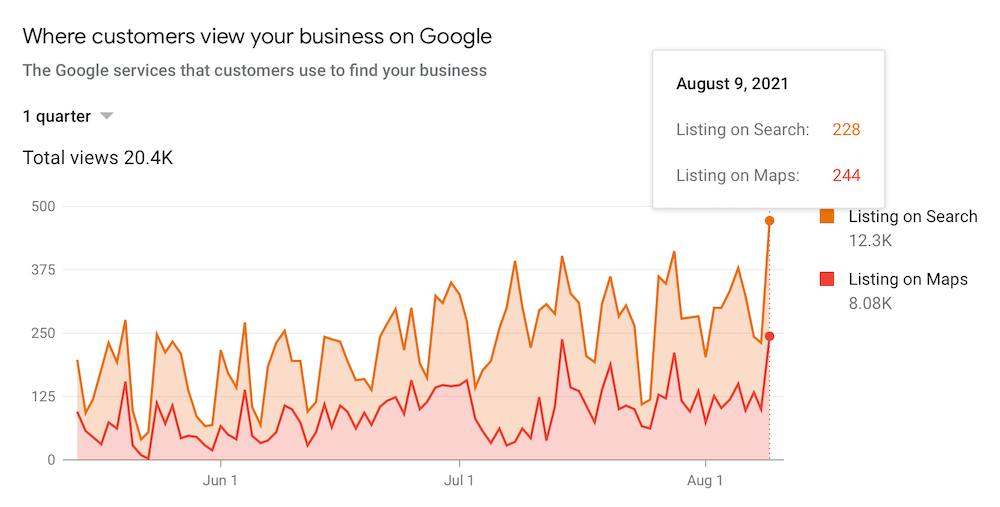
In the screenshot shown above taken on August 12, 2021, you can see that the combined map and search views are continuing to be more than 400 on most days – and sometimes reach almost 500 views. Also, notice that the combined views in a quarter are now at 20.4k vs. 2.76k as reported in March of 2021.
Since this client has two websites that we manage for them, for the last two months of 2021 they wanted us to focus all of our SEO efforts on the secondary website. We halted publishing website content on the primary website, and the frequency of GBP posts dropped to a few a month for November and December.
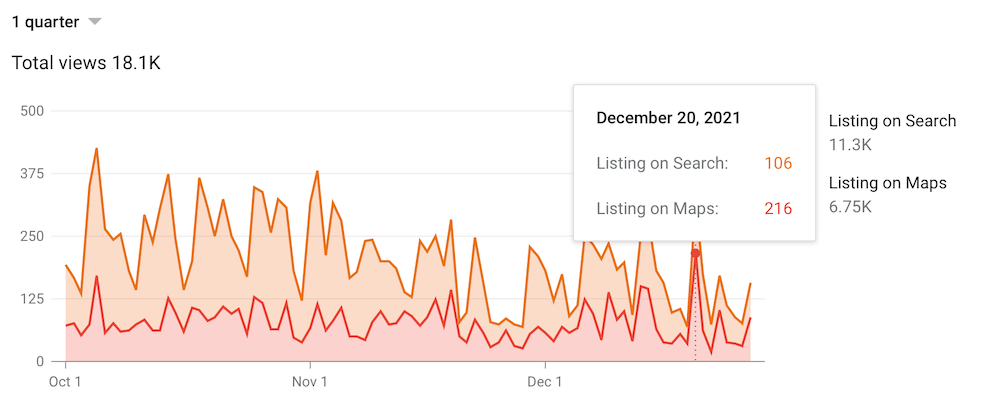
As you can see above in the screenshot taken on December 30, 2021, this change in focus did have an impact on the business’ search and map views. The combined views for the quarter dropped to 18.1k, and daily combined views for search and maps decreased as well. The closer we got to the end of the year, the less views there were. This is tied to the fact that the content on the GBP is now somewhat stale, and the website had not had anything new published, which meant we were not sharing that to the GBP either.
We thought you may be interested in seeing how the customer actions taken are performing, since we have only mentioned it once prior.
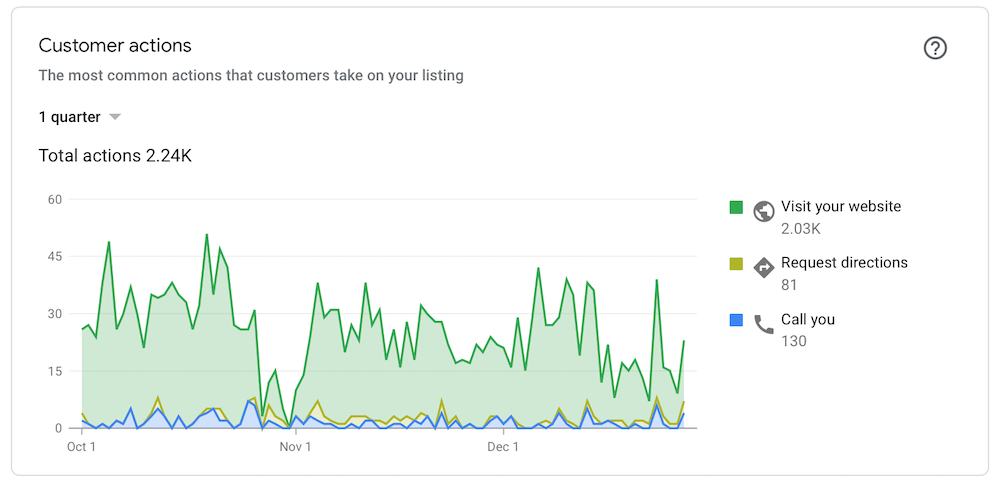
The screenshot taken above on December 30, 2021 demonstrates that customer actions taken have increased from 1.29k in a quarter (June 2021) to 2.24k in a quarter (December 2021). The June screenshot reports that 1.04k of these actions were to the business’ website, and the December screenshot reports that 2.03k were to the business’ website.
Starting in January 2022 we reverted back to focusing the majority of our optimization and ongoing SEO efforts on the business’ primary website. It will be interesting to see how long it will take for the daily combined views to increase once more.
The above provides clear evidence for why every business needs a Google Business Profile – and not just any business profile, but one that is well-optimized and managed on an ongoing basis. Now, ask yourself is your Google Business Profile getting results like this?
We Help Businesses With Google Business Profile Optimization
If you need your Google Business Profile optimized, Rocks Digital can help. We have worked with businesses across the United States, creating, claiming and optimizing their Google Business Profile. For assistance, call (214) 989-7549 or request a Google Business Profile evaluation now.
Image Credits – Screenshots provided by author.
Lissa Duty
Lissa Duty is Social Media Coach, Author, Speaker & Trainer. 20 years of marketing, administrative and management experience working to grow your business.


