Facebook bought Instagram in 2012, and since then has made some various changes to the platform – some good and some bad, if you ask users and marketers alike.
In this article, my aim is to cover the basics of Instagram for those who have already ventured to the network but might not be getting the successes they want. We’ll discuss metrics to watch and what they mean, but also help you figure out what is best to do on Instagram with your brand.
The Best Instagram Metrics for Your Brand
Strategy – First and Foremost
Before you can really dive into the platform (like on all other platforms) you need to make sure you have mapped out a strategy! This sounds a lot more complicated than it is, and for some small business owners that are beginners in the realm of marketing, it might sound scary. Hopefully, this is not you. As a business owner, you should be ready to try new things all the time to find out what works for you.
Now onto strategies. There are a ton of strategies to use on Instagram. Some people have been using the profile page to showcase sales using tools like this one. The effect looks pretty cool when you have all those small images making one large one. Just don’t forget that when posting new photos, the arrangement will change these collages. Take a look at Reynold’s Kitchens. If you scroll through the whole profile, that table keeps going and going, season to season. Kudos to that marketing team – too bad they’ve stopped updating.
Some are using themes. This is a local bike tour account for Tulsa. I LOVE that they add the bike to every shot, but it doesn’t have to be the point of focus. Here’s one of those:
A post shared by Tulsa Bicycle Tours (@tulsabicycletours) on
If you look at their feed, it’s a brilliant strategy for their brand because they are showcasing their purpose (bicycle tours) and the city in which the tours will be.
Instagram and Quote-Picture-Quote
Another strategy that I’ve just started noticing is the “quote-picture-quote” [click there for an example of what I’m talking about]. When a user takes a look at your brand profile with this strategy, you get this mosaic of words plus pictures. If you coordinate everything with your brand colors, or a seasonal theme (such as for fashion or beauty) you can create a powerful visual.
Others opt for a color theme, where the entire profile is shaped by one singular color, either through the use of filters or staging. If you take a look at my Instagram profile – and while you’re there, why not follow? 😉 – you’ll notice I have used this strategy to try it out. Another example is this account that uses a monochromatic theme throughout.

Here’s another you can try: a monthly theme. Adobe does this by choosing a topic to highlight each month and then focusing all of their images around that. April was about the Earth, March was Celebrating Women, and before that, they used “Adobe Seeing Red.” If you use this strategy, you might want to stick to topics that 1) set your brand apart from competitors, 2) the brand cares about [like Tito’s vodka], and that 3) your customers care about.
Overall, you have a TON of options when it comes to themes: You are limited only by your imagination (or your team’s total imagination). Strategy also has to do with how often you’ll post, and that mostly comes with trial and error. To start, try once a day around evening, 8 or 9 pm, or more often if you have a great community following. Be sure to build on that by following other accounts that will engage with you, or that you enjoy engaging with, and liking and commenting on other posts in the feed. Stick to it for a month and then we’ll work on how to go from there.
Must-Study Metrics for Instagram
Instagram, like all the other social platforms, has analytics that give brands access to the insights of what is happening with their posts. Most people think of the number of “likes” that a post gets as a good engagement number to pay attention to, and while they aren’t completely wrong, it’s not the only number to pay attention to.
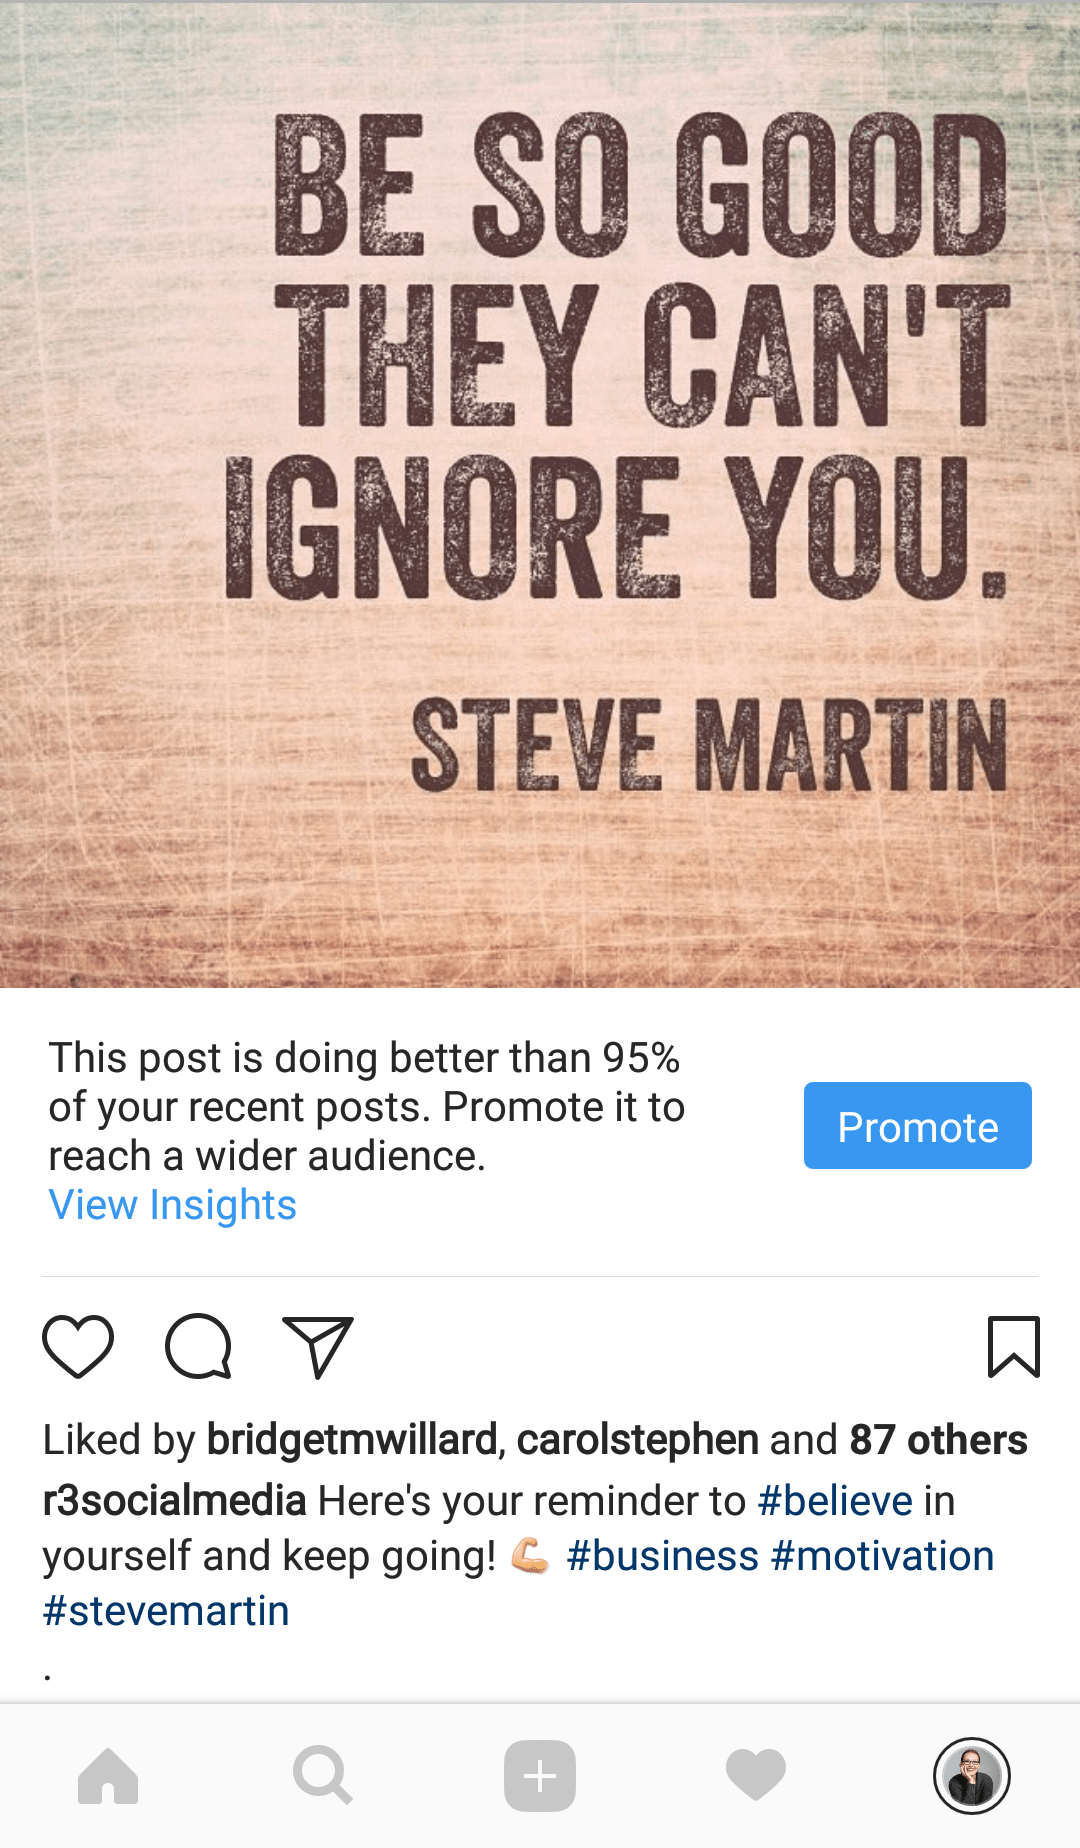
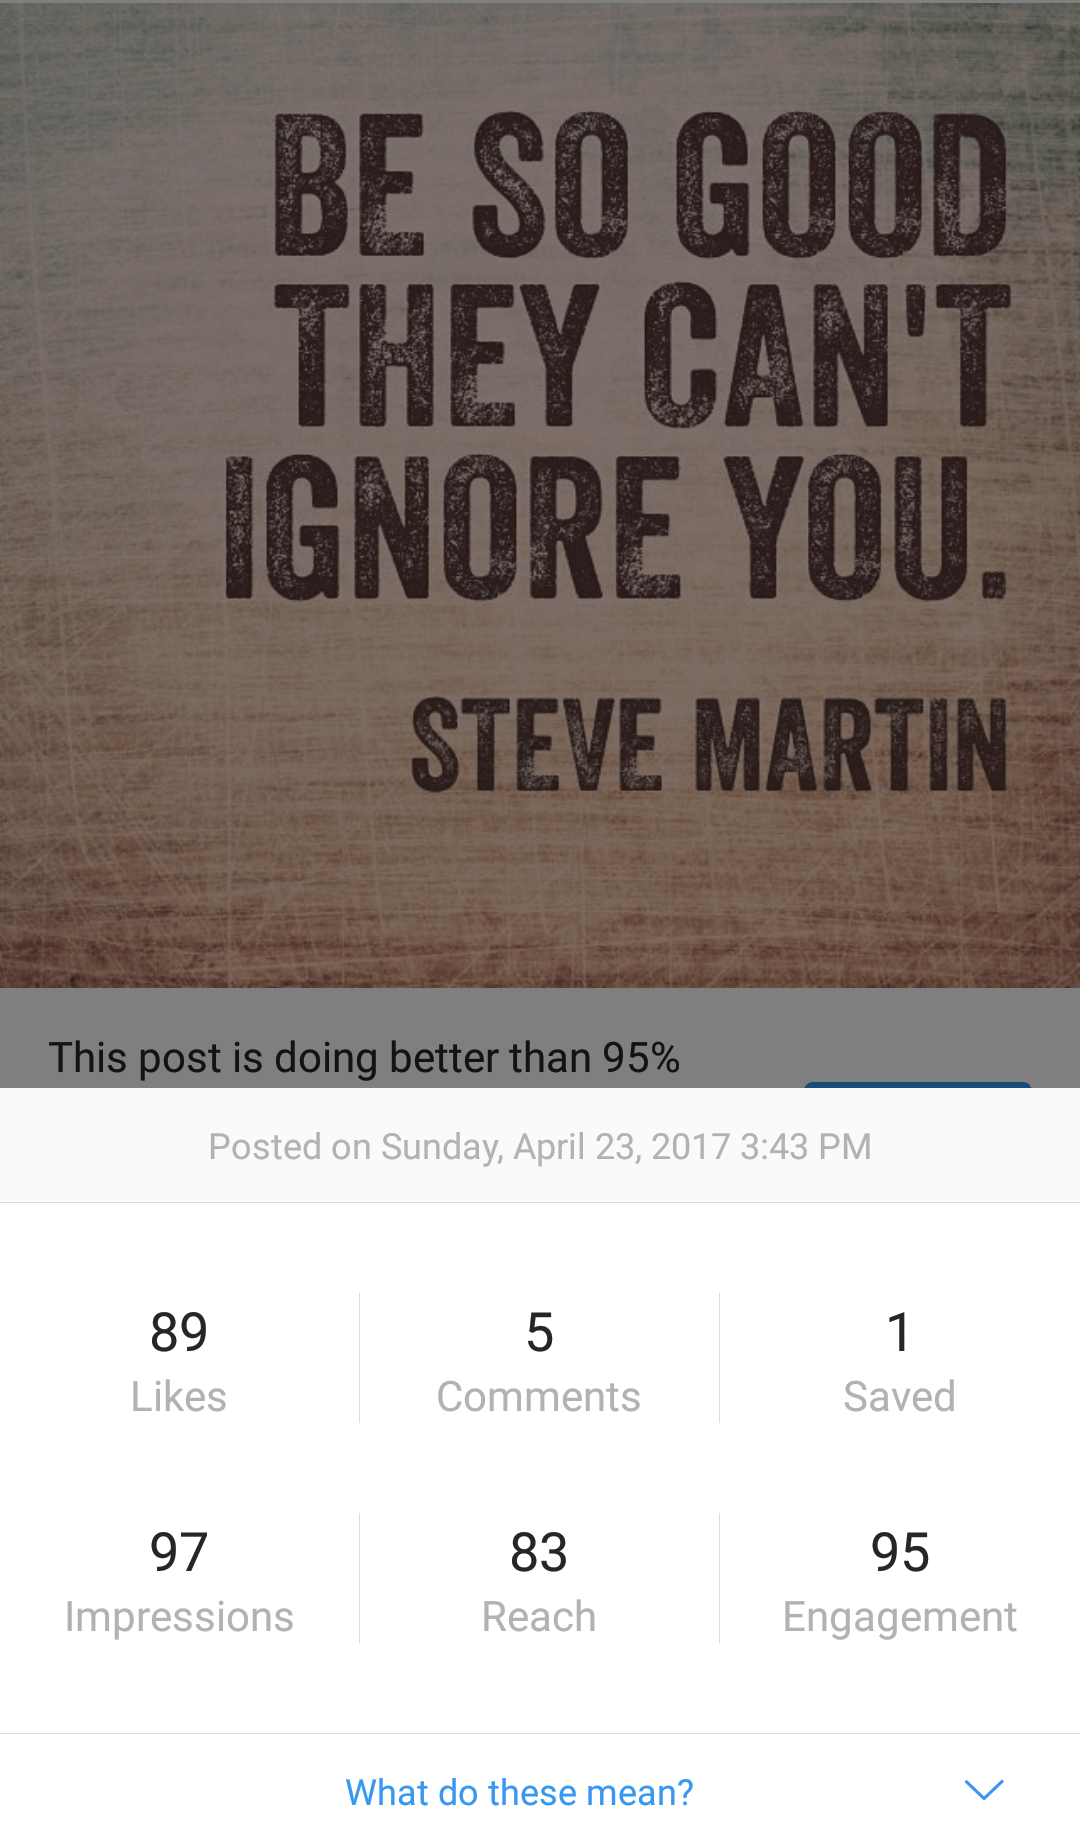
So, you’ve stuck to your strategy for a little while and you’re ready to sit down and take a look at the insights. Unlike other platforms that provide an insights dashboard, Instagram doesn’t give you the option to view these from a computer, but only from a mobile device. In order to find out how a post has done, you can go to the individual post and click “View Insights.” This will give you a box that shows you the numbers you need to see, like below.
Now, that helps if you’re interested in just one post. If you’d like to take a look at your top posts for the past 7 days all the way up to 2 years (with a few different options between those two), you can go to your insights dashboard by clicking your avatar in the bottom right-hand corner, click the bar graph symbol in the top right-hand corner, then clicking “See More” on the right of “Top Posts.” On the top of this page, you’ll see “Show __ posted in the last _____ sorted by ____.” If you tap on this, you can open your filter options and check out whatever metrics you would like, sorted however you would like.
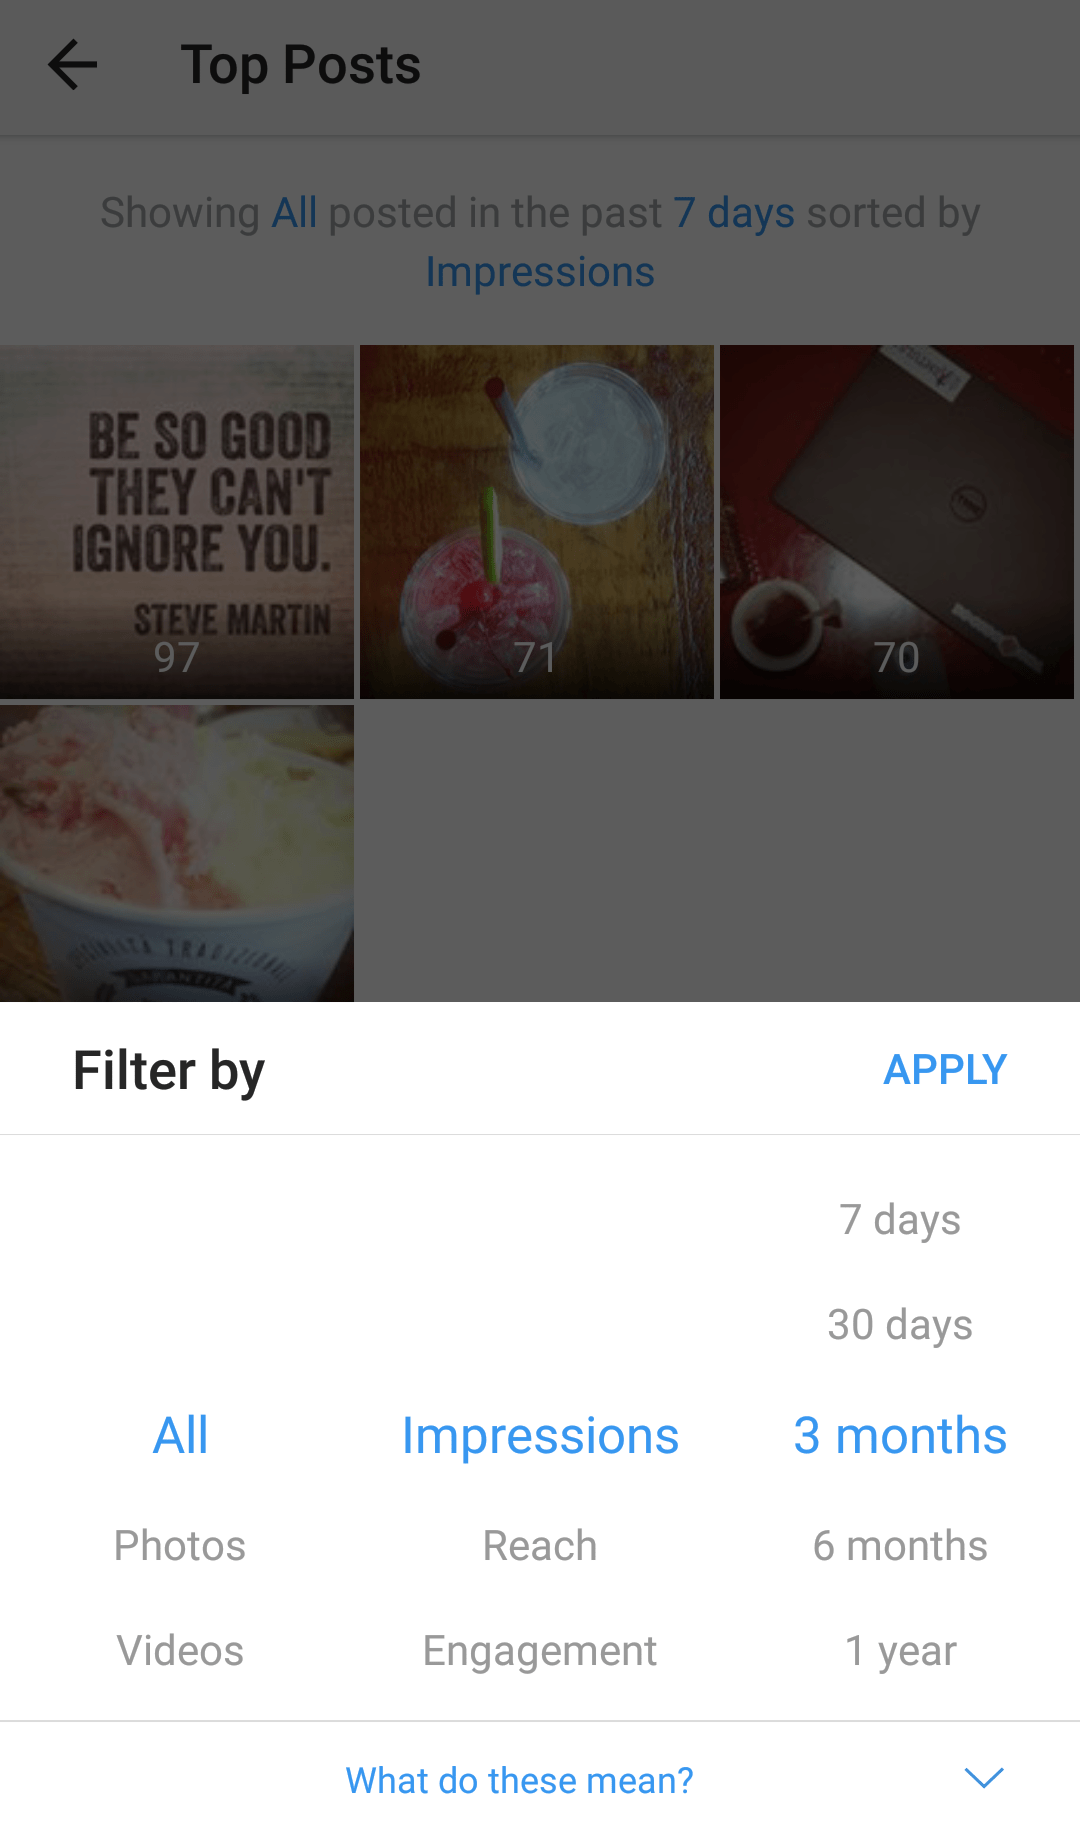
Instagram Provides 6 Metrics
Now that you know how to get there, let’s look at the metrics that mean the most. Instagram measures Reach, Impressions, Engagement, Likes, Comments, and Saves. Now, many people do get Reach and Impressions confused, but it’s pretty easy: Impressions is the total number of times your post was seen. One person can see your post 5 times. Each time they do, you get an Impression. Reach is the number of unique people who see your post. Each unique person/account will only be counted once, even if they see your post more than once. And Engagement is the total number of likes, saves, and comments.
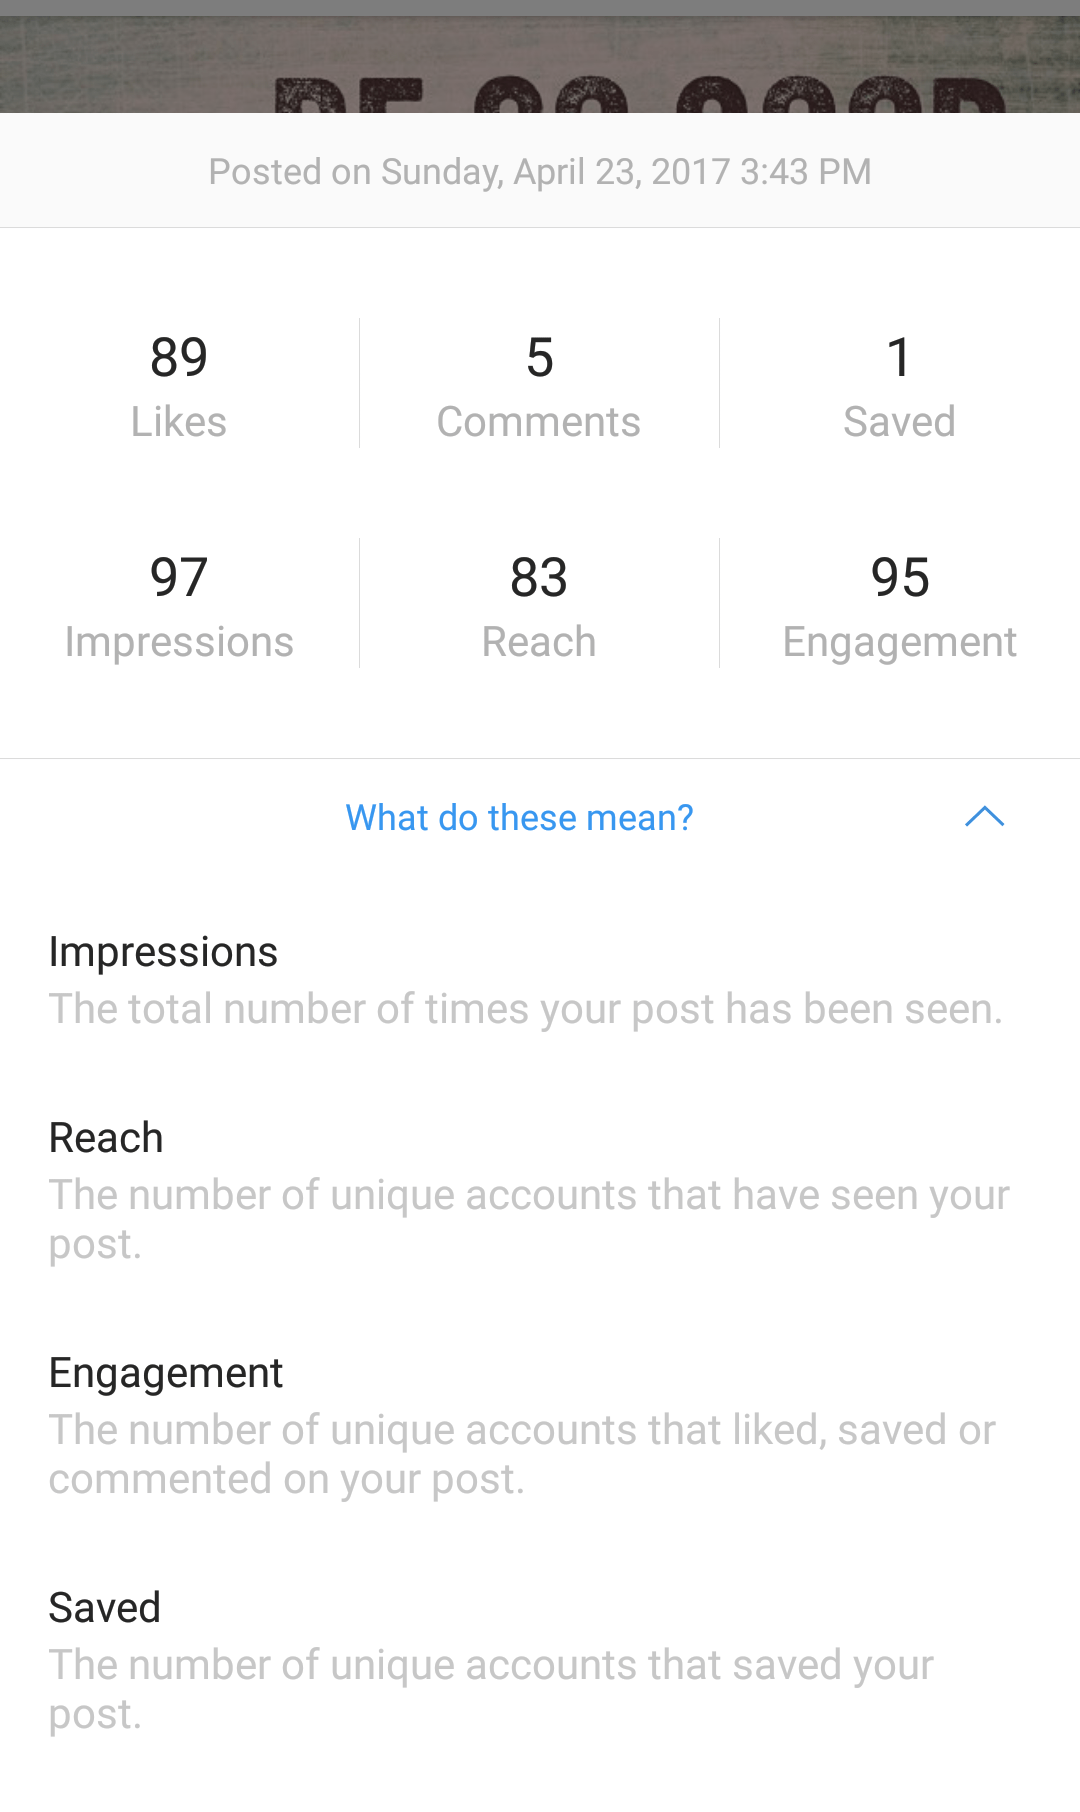
We definitely want to know about our Engagement, but we aren’t going to be focused too much on Impressions. What we want to watch is our Reach versus our Engagement.
Deeper Dive into Instagram Metrics
(Quick note, there are other measurements that I am not mentioning in this article, to keep it from becoming a book! J Please stay tuned to my RocksDigital author page for more insights on this and other social media related topics.)
You see, when someone sees your post and Engages with it, you get one Reach for that particular person, and one Engagement for every Engagement they leave. So, if I saw a picture that I enjoyed so much that I both liked it AND commented, that Engagement is 2, for 1 Reach.
Let’s say you have 10 followers. If every one of those 10 people both liked and commented on your post, you are on fire! The Engagement rate for that post would be 200% [because Engagements/Followers=2]. Now, that’s only if those 10 people were the only people your post Reached. Let’s say Instagram says you have a Reach of 20. We know we have 20 Engagements. If we use this formula: Engagement/Reach, you’ll get another Engagement rate. This time we have an Engagement rate of 100%.
You can see how this number can be a tad flawed with the description of our scenario – 10 people left us those 20 Engagements – but our Reach says 10 more people saw our post and did nothing. So, the first 10 made up for the second set of people that didn’t engage at all. So, if all we do is count our followers in our formula, we’re not going to have an accurate picture of the Engagement Rate for a particular post. This is because hashtags extend our Reach, and our followers are NOT the only ones seeing our posts. However, by definition, the Instagram Engagement Rate formula is Engagements / Followers = Engagement Rate %.
Here’s a real-life example:

As you can see in this photo, I have an Engagement of 95 and Reach of 83. If we use our Engagement Rate formula, this post has a rate of 114%. That’s a great Engagement rate.
If we use the other formula (Engagements/Followers), for my overall account, my Engagement rate is 523%. The issue with using THIS number is that it is NOT post-centric. This formula focuses on the account’s OVERALL Engagement, for every post ever made. This number is hard to measure without using a tool as well because you have to go and count up the Engagements on every post. Instagram does NOT give you the total for the entire account anywhere – only for your top posts.
(Another side note: Instagram ALSO includes your own brand comments on your posts in the Engagements number, so if you use the strategy of posting more hashtags in a comment below your photo, rather than in the caption, this will count as an Engagement, thus messing with your numbers. This is also true about your comments replying to others as they have engaged with you. However, since no one is immune to this, you can either go through the hassle of attempting to eliminate those comments in your numbers or just let them be and understand that the numbers are just a little off for everyone – even for the people using tools.)
All the Instagram Tools
Here are some of the tools that will provide you some pretty awesome charts and reports, as well as the metrics we’ve discussed in this article. Pick your favorite and start tracking your results!
https://sproutsocial.com/features/instagram-analytics
https://www.socialbakers.com/free-tools/tracker/
What’s Next?
So now that you’re squared away on how to measure and what to measure, just be sure that you are adjusting. What do the people like or don’t like? Add more of what they like and avoid what they don’t like. Try new strategies, and ask your customers what they like or want to see. The best thing you can do for your brand is to learn from and about your customers. Now, go forth and market your brand!
Are you measuring how your Instagram posts are doing with these metrics? Share what you have discovered with us!
Roxanne Roark
Roxanne R. Roark is a seasoned social media marketer from Tulsa, Ok, with a passion for learning and conquering the digital space for her clients through strategic social media marketing!


